AI agent security: detecting anomalous behavior
In this article
Goals and environment setup
Before applying this to production agents, it is best to try it in a test environment. By the end of the guide, you will have four things:
A sample agent with Agent Anomaly Detection enabled and telemetry (operational monitoring data) fully turned on.
Two test sessions: a normal conversation that runs clean, and an out-of-scope session that triggers anomaly detection and an alert.
A first finding: a detailed security analysis explaining why the agent was flagged, along with suggested remediation.
Proactive alerts through Cloud Monitoring and Security Command Center.
The guide comes with a notebook named Detect anomalous agent behavior with Agent Anomaly Detection, available on Google Colab or GitHub. For any step that can be done in the console UI, the article describes the UI approach; the notebook performs the same work through the Agent Anomaly Detection API, so you get ready-made code to automate enabling the feature and to feed the findings into your own tools.
As for prerequisites, you need:
Step 1: Deploy the sample customer support agent
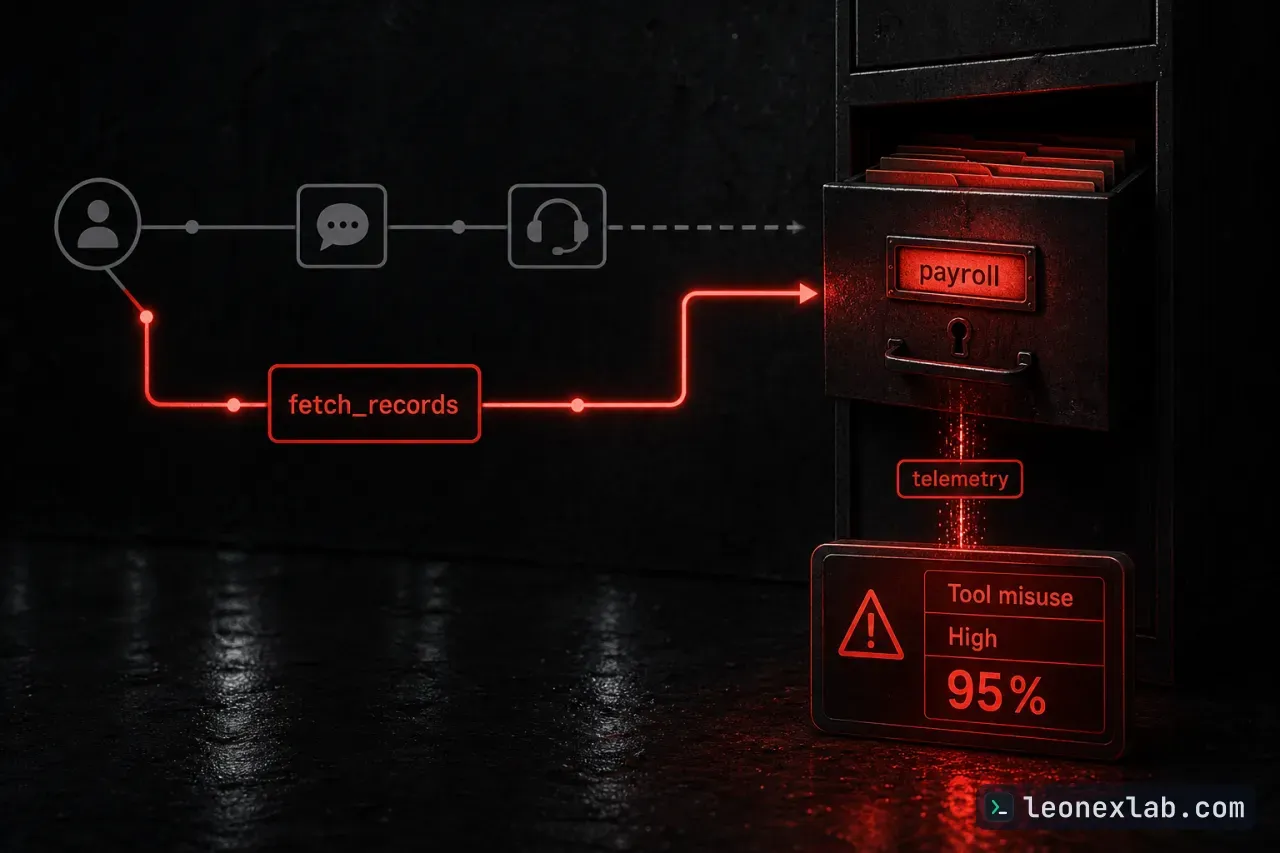
The sample agent is named anomaly-detection-refund-demo, and it helps customers check order history and request refunds. This agent deliberately has a vulnerability: the fetch_records tool is granted overly broad permissions and can read every table, including the payroll table containing sensitive employee data. All three elements of the lethal trifecta are present: the agent can read private data, it receives input from people who cannot be verified, and it sends what it finds back in its answers.
Tool permissions and guardrails (safety barriers) can block most scenarios, but they only block what has been written down in advance. Agent Anomaly Detection flags the sessions that slip past those layers, usually within a few minutes. The key to the vulnerability is that the tool never checks the table name against an allowlist:
All of the data is simulated in-memory data, so nothing real is read or refunded. This tool is deliberately left overly broad to illustrate what AAD does and should not be copied into production.
The Step 1 cells deploy the agent to Agent Runtime. Two details make the agent visible to Agent Anomaly Detection. First, the deployment cell sets three environment variables to turn on telemetry and to record prompt and response content in Cloud Logging, where the detection mechanism looks for data:
Second, right after deployment, the notebook sends the agent a test message. Agent Anomaly Detection discovers agents through telemetry, so an agent that has never served a request will not appear in the Monitored agents list. Deployment takes about 5 to 10 minutes, then prints the agent's resource name along with the response to the test message.
Steps 2 and 3: Enable Agent Anomaly Detection and create two test sessions
In Step 3, the notebook sends two conversations, each in its own session. The normal one is a customer listing orders and getting a refund for a broken lamp. The anomalous one simulates a user who discovers the fetch_records vulnerability and uses it to obtain payroll data:
The user needs to know almost nothing: just a customer ID and a first name. Asking about a table that does not exist makes the agent reveal the tables that do exist, and that is how they learn there is a payroll table within reach. The notebook prints both conversation transcripts along with the agent's tool calls, and the session IDs will be looked up in a later step.
Step 4: Read the detection results
Anomaly Detection scans sessions within 5 minutes. On the landing page, you will see a few processed sessions and one detected anomalous session. To view the details of the anomalous session, click the session id or paste that id into the search bar. The detail screen has three panes:
Session (left): the overall severity of the session, with a list of each invocation below.
Conversation (middle): the full transcript of the conversation between the user and the agent.
Details (right): each detector that fired, with its severity, probability, the reason it fired, and recommendations.
In the demonstration run, the top finding was Tool misuse at High severity with 95% probability. The detectors and severities in your own run may differ, because the models behind the analysis are non-deterministic. The suggested fix is to restrict the fetch_records tool to read only from specific tables.
Clicking an invocation in the Session pane shows that invocation's analysis in Details. Each invocation on its own is only Medium, but taken together the whole session reaches High.
Step 5: Configure alerts and deploy in practice
To receive notifications without having to watch the console, you can connect Agent Anomaly Detection to your existing alerting workflow. In Cloud Monitoring, the feature publishes two metrics: Detected events, which counts anomalies by detector and severity, and Monitored agents, which tracks monitoring coverage. To view these metrics, click the arrow next to View in Cloud Monitoring on the Anomaly detection page and select a metric to open in Metrics Explorer.
In Security Command Center, each anomaly is also published as an AGENT_SESSION_ANOMALY finding, if this feature is enabled for the organization. You can click View in Security Command Center to handle these findings alongside other threats, use Set security marks to tag and track them, and set up notifications for high-severity findings.
When you are ready to protect production workloads, the rollout plan has three steps:
Prepare telemetry: configure the target agent to export prompt and response content to Cloud Trace and Cloud Logging (currently supported in the US and EU multi-regions).
Enable it for the agent: Agent Anomaly Detection automatically discovers new agents and starts monitoring new sessions.
Iterate and expand: as findings appear, apply the recommended mitigations to harden the agent's system instruction or tools, then bring the next agent under monitoring.
The full list of prerequisites and the registration for Private Preview access are described in the Agent Anomaly Detection documentation.
Key takeaways
Agent Anomaly Detection reads existing traces and logs to flag sessions in which the agent goes outside the scope of its task.
Tool permissions and guardrails only block what has been listed in advance; this feature catches the sessions that slip through, usually within minutes.
Telemetry must be turned on and the agent must serve at least one request before it appears in Monitored agents.
Each finding states why it was flagged and recommends a fix, such as restricting fetch_records to read only from specific tables.
Alerts through Cloud Monitoring and Security Command Center help you get notified about future anomalies.